The Case Against More Dashboards
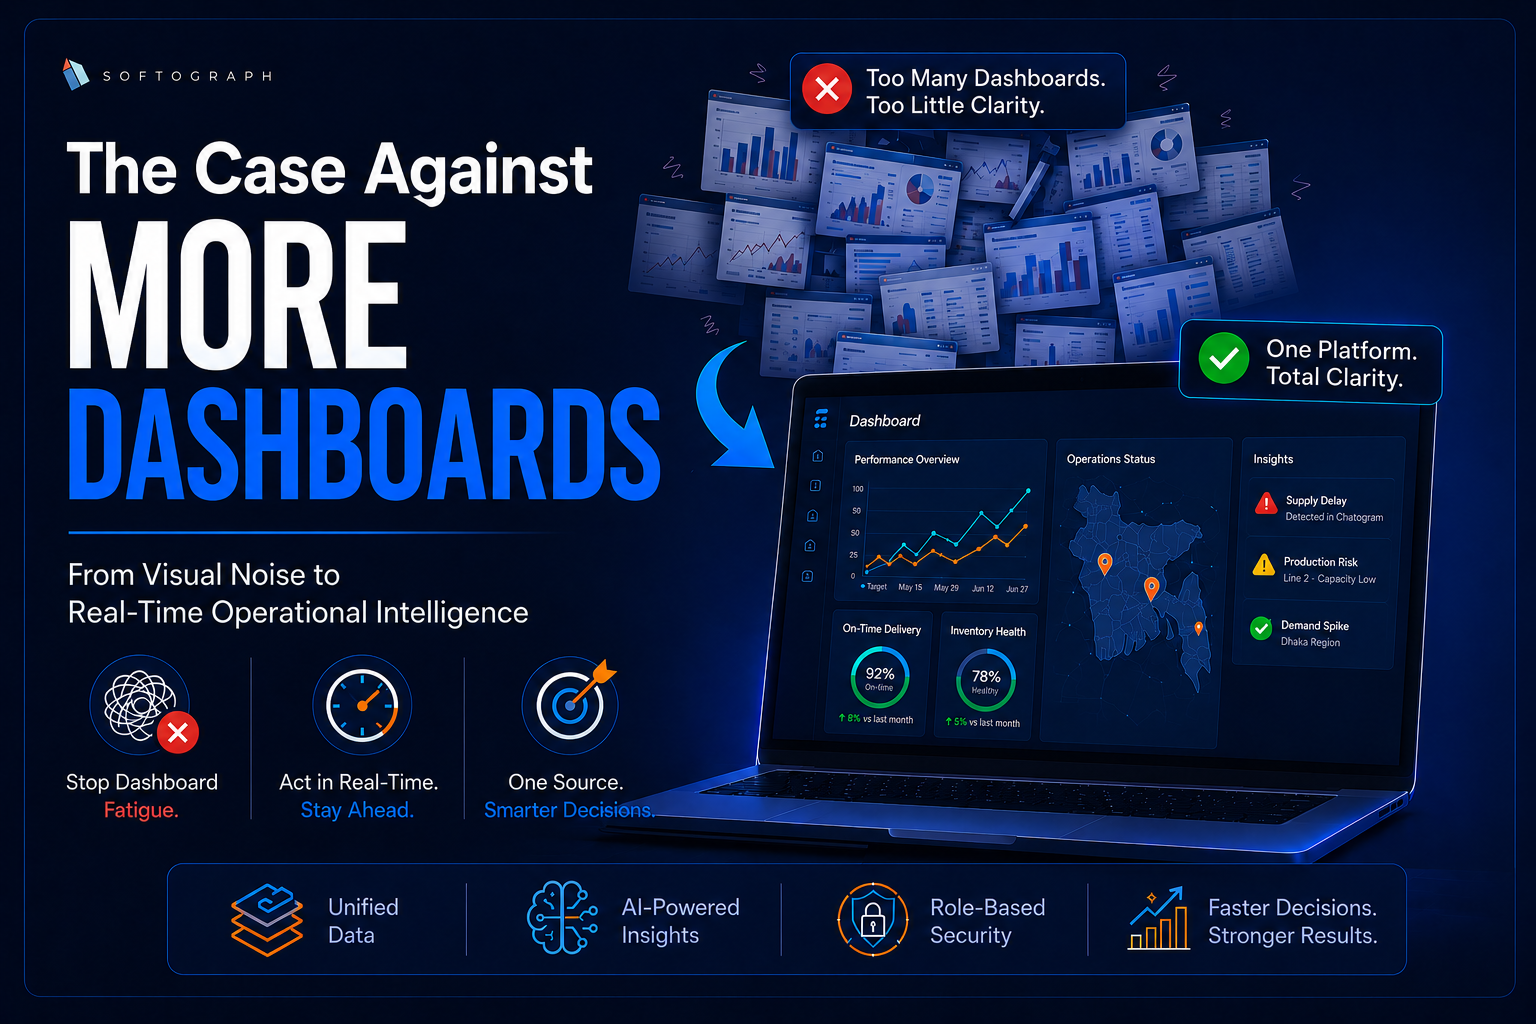
The single most pervasive illusion in corporate operations today is the belief that building another dashboard will solve your data problems.
Walk into the boardroom of any fast-growing company in Dhaka, Chittagong, or any regional economic hub, and you will find executive teams drowning in a sea of charts. Management meetings regularly devolve into lengthy debates over which mismatched, color-coded graph best represents the company’s operational footprint.
For local corporate leaders and operations managers trying to pivot amid rapid macroeconomic shifts, this over-reliance on fragmented visualization has created an unspoken crisis: dashboard fatigue. Instead of driving business momentum, organizations are paralyzing their decision-makers with raw data volume, mistaking flashy design for structural operational intelligence.
The Dashboard Fatigue Trap
When internal operational bottlenecks surface, the typical corporate response is predictable: task the IT department with building a new data visualization screen. This reactive cycle has triggered a massive accumulation of disjointed, platform-specific analytics interfaces that drain corporate resources.
Middle managers and operations executives now spend hours bouncing between siloed windows. One interface tracks supply chain logistics, another monitors real-world field sales performance, and a separate corporate report covers quarter-to-date regional revenue. This highly fragmented approach forces expensive talent to spend more time logging in, filtering charts, and manually cross-referencing indicators than extracting genuine strategic value.
The irony is clear. Dashboards were created to simplify performance tracking, but having too many of them does the exact opposite. They bury critical insights under a mountain of noise, leaving executives with too much data to look at and not enough actual intelligence to make a confident decision. While businesses rush to build more visual tracking tools, the actual case against dashboards lies in how easily they substitute real, automated decision-making with passive data hoarding.
Navigating Local Operational Shifts
In our local business landscape, agility isn’t a corporate buzzword; it is a survival metric. Whether you are managing a garment factory in Gazipur, a distribution hub in Chittagong, or a supply chain route across the country, market realities shift by the hour. Sudden spikes in raw material prices, unexpected port delays, and rapid shifts in consumer demand mean that local leaders must make critical decisions immediately.
When a production bottleneck hits the factory floor or a shipment gets stuck, you cannot afford to wait for a weekly retrospective review. Waiting for an IT analyst to pull raw data from an ERP system, clean up rows in an Excel sheet, and update a static chart means you have already lost the window to protect your profit margins. By the time the chart is ready, the financial damage is already done.
True operational agility means recognizing a problem before you run out of time to fix it. If your data system cannot give you immediate answers during a sudden disruption, it isn’t an asset; it’s an expensive distraction.
Local enterprises need a data system that moves at the exact same speed as their trucks, machines, and field teams. Standard dashboards only show you what happened yesterday, forcing you to steer your company by looking through the rearview mirror. To stay ahead in a fast-moving market, local corporate leaders must abandon these slow, backward-looking setups and adopt dynamic intelligence platforms that flag anomalies and deliver real-time, actionable insights right when they matter most.
Shifting from Visual Noise to Deep Analytics
When your data reflects real-world ground realities, the entire nature of corporate decision-making changes. You no longer have to wait for weekly summary emails or cross-reference three different software systems just to check your inventory levels or yesterday’s distribution efficiency.
By functioning as a unified, underlying layer over your existing enterprise resource planning (ERP) systems, customer relationship management (CRM) software, and legacy databases, Proggya bridges the traditional disconnect between front-line execution and boardroom strategy.
This deep integration translates directly into predictive capability. Instead of merely telling you that a distribution delay happened three days ago, Proggya identifies the subtle workflow anomalies, supply chain friction, or regional resource constraints that caused the bottleneck in the first place. This allows operations managers to address underlying issues before they turn into costly operational disruptions.
Ultimately, this transition shifts your corporate culture away from reactive troubleshooting and toward proactive strategy. Instead of losing valuable time arguing over whose spreadsheet contains the correct numbers, your leadership teams can finally collaborate using a single, verified version of operational truth.
Engineering Role-Based Information Clarity
True data utility is achieved only when the right corporate stakeholder receives the right specific information at the correct operational moment. Forcing a regional field manager and a Chief Financial Officer to look at the exact same dense analytical screen ruins structural focus and compromises operational data security.
Proggya addresses this core corporate vulnerability by delivering secure, role-based information management across the entire enterprise. Rather than flooding every team member with universal, distracting metrics, the system tailors its output to specific institutional responsibilities.
- For Operations Executives: High-fidelity, real-time visual overviews that map performance directly to long-term corporate priorities.
- For Field Managers: Granular, action-oriented intelligence structured to optimize daily throughput and eliminate operational friction.
Backed by Softograph’s extensive engineering experience across complex consumer goods, retail, and manufacturing environments, Proggya ensures that information distribution remains highly relevant and secure. This targeted communication methodology empowers corporate users to ask complex business questions naturally and receive immediate, high-impact analytical insights. The result is a unified corporate culture that prioritizes factual transparency over comfortable operational narratives, thereby optimizing decision-making at every organizational level.
A Strategy Built for True Decisiveness
The solution to information friction is never to build more visual noise. The endless cycle of deploying single-purpose dashboards only fractures your data ecosystem, introduces unnecessary human error, and slows down executive response times.
Proggya by Softograph represents the necessary transition into structured corporate intelligence. By consolidating disparate datasets, processing deep algorithmic signals, and ensuring secure data delivery through user-level access controls, Proggya equips enterprises to outsmart corporate complexity.
When your leadership teams spend more time debating conflicting visual reports than executing clear decisions, your data systems are actively working against you. True operational control requires moving past basic, passive visualization and stepping into a unified environment of real-time intelligence. By choosing a structured, centralized approach over temporary visual fixes, you protect your profit margins and gain an unshakeable competitive edge.