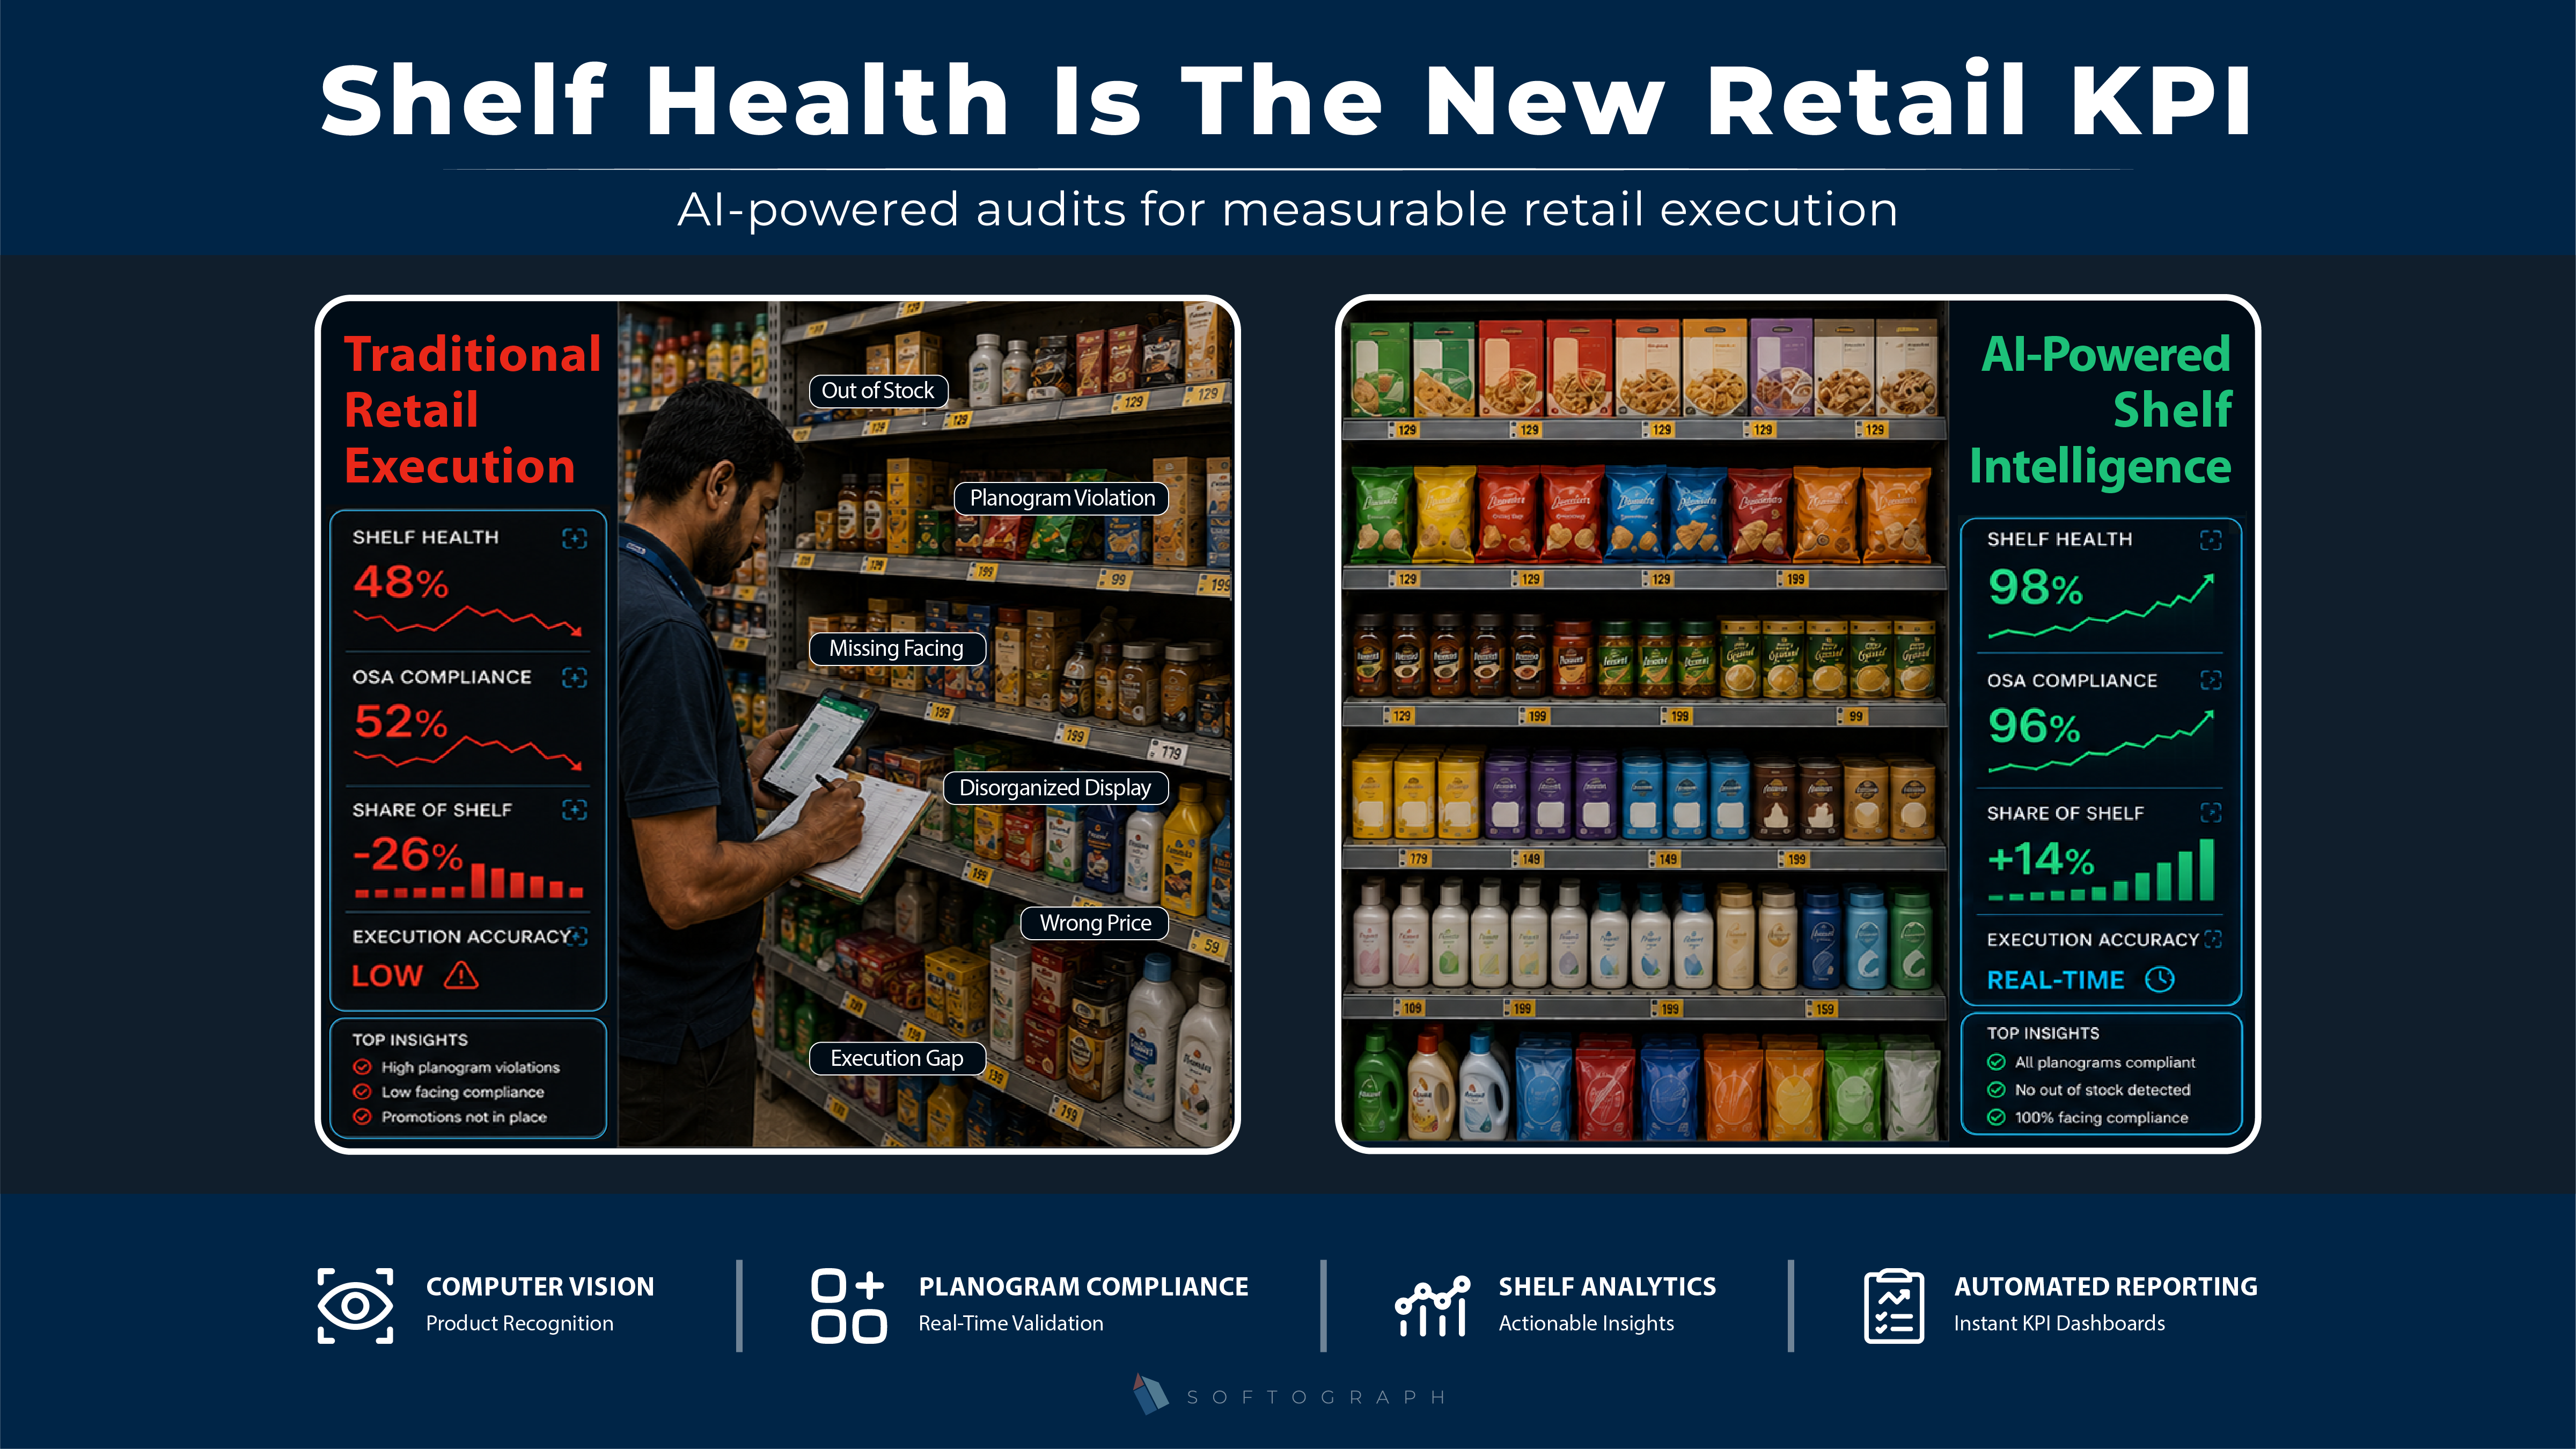
Millions are spent every year on trade marketing, premium display slots, and elaborate planograms. Yet, walk into any major retail outlet, departmental store, or local grocery hub, and the reality on the ground tells a different story. The reality on the shelves rarely matches the strategy designed in the boardroom. Out-of-stock items, misplaced products, and […]

The Archeology of Cohort: Digging Through Cohorts to Unearth Insights In the modern era of analytics, when raw numbers conceal more than they reveal, carefully sifting through surface data to uncover hidden insights is imperative for a deeper understanding. If you’ve ever asked, “Why is retention dropping?” or “Which users are truly driving growth?”, […]